Fall 2008
Volume 17 No. 3
2008 Indiana Forest Products
Price Report and Trend Analysis
William L. Hoover, Professor of Forestry, Department of Forestry and Natural Resources and Greg Preston, State Statistician, Indiana Agricultural Statistics Service, West
SURVEY PROCEDURES AND RESPONSE
Data for this survey was obtained by a mail survey of all known mills in Indiana. The prices reported are for logs delivered to the log yards of the reporting mills. This report is intended to be used as an indication of price trends, not for the appraisal of logs or standing timber (stumpage). This data is collected only once a year and log prices are constantly changing. Proper appraisal techniques by those familiar with market conditions on a day-by-day basis should be used to obtain estimates of current market values for particular stands of timber or lots of logs.
Because of the small number of mills reporting logging costs, �stumpage prices� estimated by deducting the average logging and hauling costs, (Table 4) from delivered log prices by deducting the average logging and hauling costs, Table 4, must be used with extreme caution.
The survey was sent to 260 mills. Eighty-eight mills reported some useable data, compared to 102 last year. Another 31 sawmills responded that they went out of business and six reported being inactive. Two veneer mills went out of business over the last several years. Eight respondents reported sawing for their own use only. Three mills reported specializing in ties, mine timbers, and blocking. Two mills reported sawing only logs from tree services and municipal waste, although one of these mills did pay something for these logs. This makes the overall response rate 54 percent, below last year�s 67 percent. There was an initial mailing and one reminder postcard sent to a sub-sample of non-respondents, and these mills were contacted by enumerators of the Indiana Agriculture Statistics Service. Purdue�s Department of Forestry and Natural Resources pays for this assistance using funds from its John S. Wright Endowment, not public funds.
The number of mills contributing price data for each product is shown in the fourth column in Tables 2 to 5. Fifty-six mills reported their 2007 total board foot production, compared to sixty-nine mills in 2006. Fifteen mills reported producing 500 thousand board feet (MBF) or less, a substantial decline from 2007 due to the shutdown of many of the small part-time mills. Total production for the reporting mills was 175 million in 2007, compared to 205 million board feet in 2006. Again for 2007 the largest mill responding reported 20 million board feet of output in 2007.
The price statistics by species and grade don�t include data from small custom mills because most do not buy logs, or they pay a set price for all species and grades of pallet logs. They are however the primary source of data on the cost of custom sawing. Thus, the custom sawing costs reported in Table 4 do not reflect the operating cost of large mills.
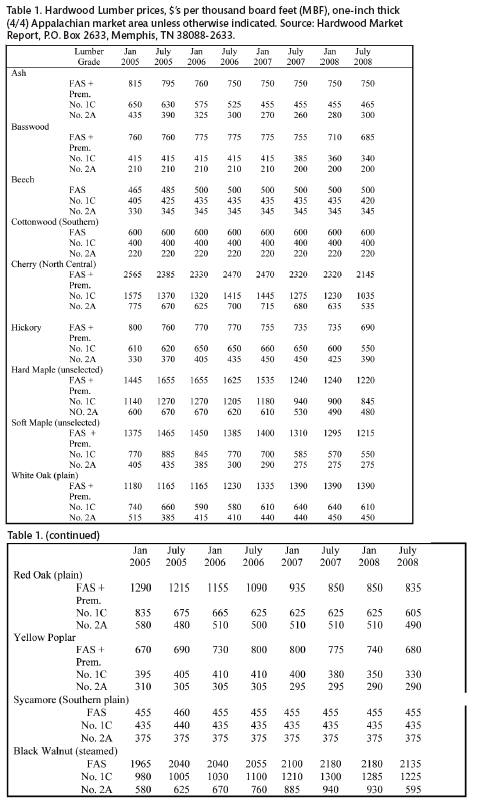
HARDWOOD LUMBER PRICES
Considering troubles in the financial markets resulting primarily from the housing bubble bursting after a period of �irrational exuberance,� many analysts are surprised that the economy has not fallen further into recession. The hardwood industry has clearly been hit hard, but nationally output has been declining since peaking in 1999. Export demand, due in large part to a very weak dollar, has reduced the impact of declines in domestic demand. Low end markets continue to be buoyed by strong demand for railroad tie and to a lesser extent timbers for construction and shipping.
The breadth and depth of the impacts from rising energy costs are just beginning to be understood. Price signals clearly work fast in a market economy on the demand side. The supply is of course much slower, but clearly underway, especially for natural gas exploration. The issue now is the extent to which the run-up in crude oil prices was one of the many commodity bubbles now adjusting to fundamental supply and demand conditions. Whatever the energy outlook, the margins of hardwood producers have been wiped out by rising costs and declining lumber price.
There has also been an impact on the logging sector with increased reports of timber not finding its way to mills because of the decline in the number of loggers, frequently referred to as �producers� by those in the industry. U.S. hardwood lumber production peaked in 1999 at about 12.6 billion board feet. As of 2007, production had declined over 15 percent from the peak and is expected to decline further this year. Prices for all the prime species declined over the last 12 months except white oak, Table 1. Black walnut declined very little over this period and is up compared to 2005 - 2006. Prices for the top grade of ash, beech, cottonwood and sycamore lumber were unchanged, although the lower grades of ash increased slightly.
Red oak lumber price for the best grade, FAS plus the premium, was down 35 percent from January 2005 to July 2008, but based on the highly questionable US Department of Commerce estimates of total lumber production and production by species, red oak output stayed at 20 percent of total output from 1999 to 2007.
White oak production declined only 8 percent from 1999 to 2007,
but increased slightly (well within the margin of error) as a percent of total
production, from 9.6 percent in 1999 to 10.4 percent in 2007. Demand for tight
cooperage, riff and quarter sawn lumber, and log and veneer exports most likely
supported these price levels. Black walnut and beech are the smallest volume
species broken out in the Department of Commerce reports, but while beech output
declined by 45 percent from 1999 to 2007, black walnut increased by 74 percent
over the period. The increase was from an estimated 43 million board feet in
1999 to 78 million in 2007.
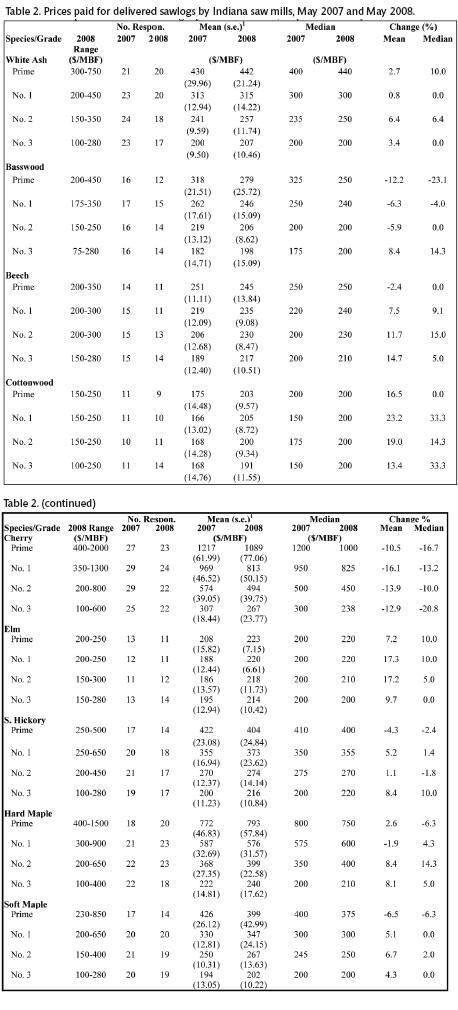
SAWLOG PRICES
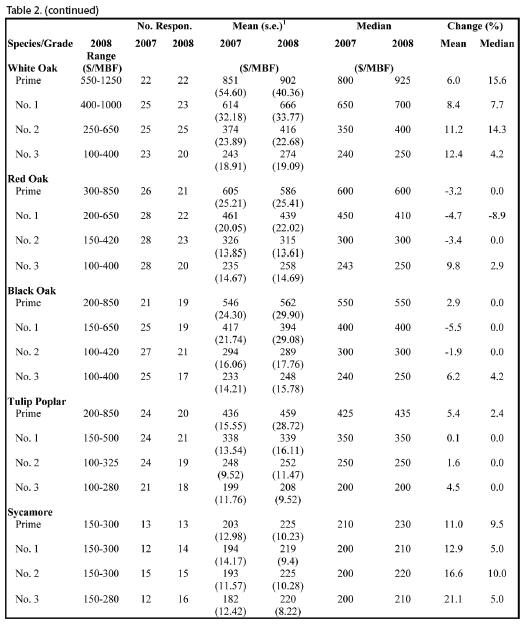
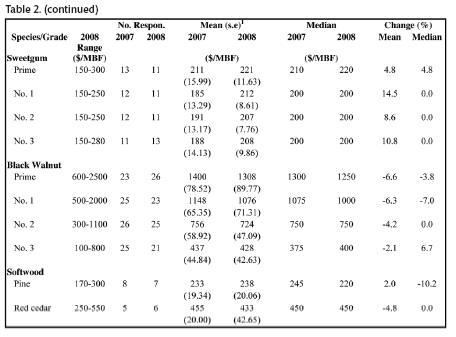
Sawlog prices, Table 2, were generally up, much to our surprise, after being generally down last year. The number of mills reporting in each species and grade category was down slightly, but not enough to suspect that the increases were due to changes in the sample. Black cherry suffered the largest decline, 10 to 15 percent depending on log grade. Black walnut declined 2 to 6 percent, a surprise given increased production of this species. White oak was up 6 to 12 percent while red oak was down 3 to 5 percent. The largest increases were for the non-prime species, cottonwood, elm, sycamore and gum; and the lower grades of many species because of the demand for tie and timber logs. A large portion of the supply of these logs, usually referred to as pallet logs, and lower grade lumber for pallets, is typically a byproduct of grade lumber production. But the decline in grade production has required pallet, and tie and timber producers to seek out log supplies supplies independently.
SOFTWOOD LOGS
The average for the 7 mills reporting pine sawlogs was up by about 2 percent, from $233 to $238 per MBF, perhaps reflecting continued demand for cabin logs. The niche market for red cedar logs remained viable with prices down about 5 percent. Many red cedar products are tied to housing construction.
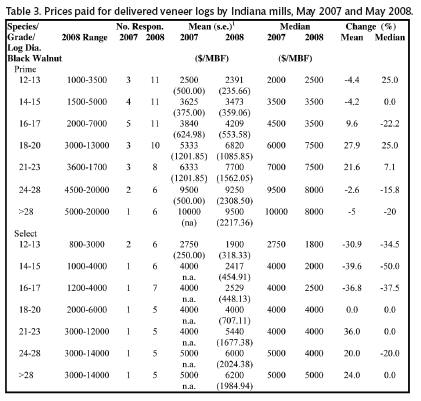
VENEER LOG PRICES
As usual veneer log prices, Table 3, followed the direction of sawlogs of the same species. Fortunately the number of mills reporting veneer log prices increased, providing more reliable results. Many of the price changes shown are highly questionable because of the small number of mills reporting in 2007. For black walnut, and black cherry the prices of logs in the small diameter inside bark (dib) classes declined while prices for the larger logs increased. White oak was up in the 20 percent and higher range for all sizes but the smallest. Red oak was also up, compared to 2007 prices when only on 1 to 3 mills reported.
IMPLICATIONS
There is a time lag between when timber buyers decide that it�s necessary to reduce their offers, and when timber sellers learn that demand is down. Last year�s declines were likely due primarily to reduced demand. The lack of further major declines this year is likely due to a decline in the volume of timber owners are willing to sell because of their perception of poor markets. If supply falls more than demand, price increases result. This pattern has been observed in past downturns in this industry.
The value of the dollar against all other major currencies has been increasing over the last month, and the European economies have been slowing down. This may result in declines in exports to European markets. There are also signs of slowdowns in Asia. Unless the domestic economy picks up in a hurry further declines in demand in many hardwood markets are likely. The tie and timber market should remain strong, however, because of continued expansion and repair of rail lines. Rail use will continue to increase even if diesel fuel prices decrease another $0.50 per gallon. Offerings of �pallet timber� should remain more attractive than usual. Prices of beech, gum, cottonwood, and lower grades of oak tend to change slowly, and less cyclically. There is no reason for would-be sellers to stay out of the market. The call on the premium species, especially of good quality is hard to judge. Future prices could go up further ifs supply decreases more than the expected decrease in demand. The standard advice we give applies now more than ever. Timber owners should discuss their cash and timber management needs with market professionals who are on top of current conditions in local markets. Fortunately there is no commodity bubble to burst in the hardwood timber market. Timber buyers only hedging option is to buy ahead of need with long-term contracts with no option to spread the risk in a futures market.
CUSTOM COSTS
The average cost reported for custom sawing in 2008 was $274 per
MBF, up from $250 per MBF in 2007, Table 4. The mills reporting are primarily
small �local� mills, many portable. Three mills reported their cost per hour.
The average was $62, up $2 from 2007. Average logging cost was $138 per MBF, up
$28 from 2007. The reported cost of hauling almost doubled going to $100 per MBF
from $53 in 2007. The calculated cost per MBF per mile also almost doubled,
going from $1.05 in 2007 to $1.98 in 2008. The average logging cost of $138 per
MBF, plus and a hauling cost of $1.98 per MBF for the 45 mile average haul
($89), give amount to a cost of $227 to put a thousand board feet of logs on a
mill deck, compared to $163 per MBF in 2007. With the average price of pallet
logs at $248, Table 5, the so-called �conversion surplus� is $21 per MBF or �2 a
foot. Thus, as has always been the case, recovering grade lumber from squaring
up ties and cants is critical.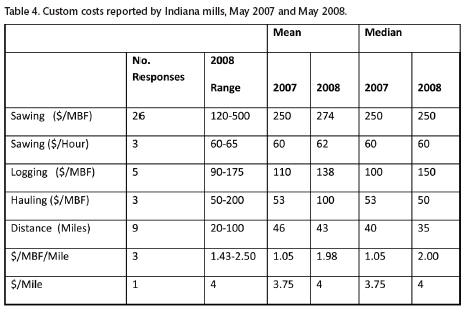
MISCELLANEOUS PRODUCTS
The average price paid for cant logs, i.e. logs sawn for pallet lumber and railroad ties, was $248 per MBF, up from $239 in 2007, Table 5. The price per ton increased from $$32 in 2007 to $39 in 2008. Pulp chip prices increased $6 per ton, while pulpwood was up $3 per ton.
There is still an excellent market for bark for mulch, although
reported prices were down. Dry residue demand is expected to increase with at
least 2 wood pellet plants in operation and more on the planning board. Ground
has been broken for a cellulosic ethanol pilot plant in central Pennsylvania.
This technology will come to Indiana over the next 5 years, increasing the
demand for green wood residue.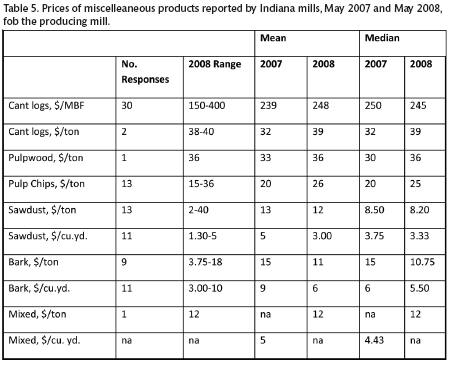
INDIANA TIMBER PRICE INDEX
The delivered log prices collected in the Indiana Forest Products Price Survey are used to calculate the delivered log value of typical stands of timber. This provides trend-line information that can be used to monitor long-term price trends for timber. The species and log quality distributions used to calculate the weighted averages can be found in the detailed on-line report.
Each year the previous year�s number is recalculated using the
producer price index for finished goods for the entire year. The price index
used for the current year is the last one reported for the month when the
analysis is conducted, July this year. The inflation rate increased
substantially over the last 2 years, hitting over 9 percent based on the rate
for the month of July of 2008.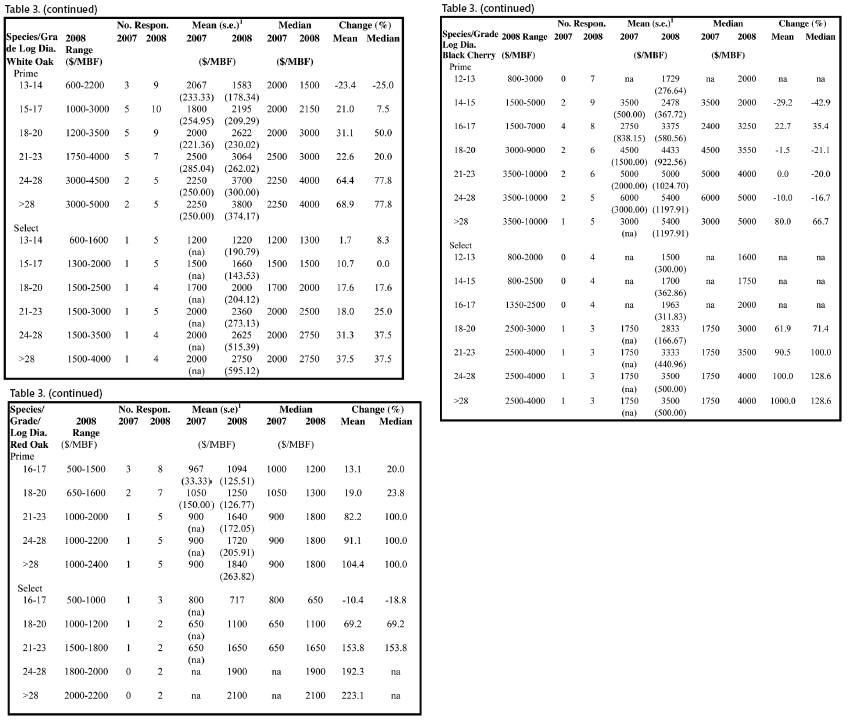
AVERAGE STAND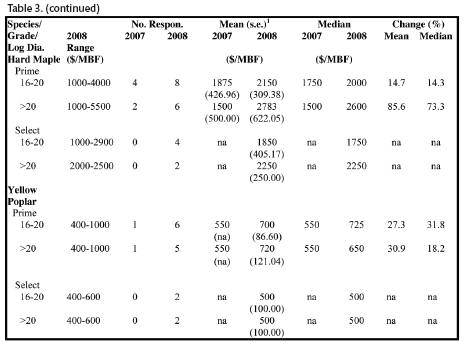
The nominal weighted average price for the average stand increased from $414.7 per MBF in 2007 to $433.7 per MBF in 2008, Figure 3. This is a 4.7 percent increase. The deflated or real price decreased from $248.6 per MBF to $237.60, a 4.4 percent decrease. This decrease was enough to continue the slow decline in the trend line rate for the real price series.
The new equation for the trend line for the 1957 to 2008 period is, Avg. Stand Real Price = 170.59 + 2.37 x T, where T=1 for 1957, 2 for 1958 � 52 for 2008 The real price increase dropped to just over 1 percent at about 1.02 percent per annum. Thus, the purchasing power of hardwood timber assets in the long-run continues to exceed the rate of inflation by about 1 percent.
QUALITY STAND
The nominal weighted average price for the quality stand increased by 14.8 percent from $560.1 in 2007 to $643.2 in 2008, Figure 4. The average real price for the quality stand also increased from $336.1 per MBF in 2007 to $352.4 in 2008, a 4.8 percent increase. The average annual compound rate of increase for the trend line declined to 1.33 with 2008 included from 1.38 percent per annum for the trend through 2007. The equation for the trend line is, Quality Stand Real Price = 203.48 + 4.016 x T, where T=1 for 1957, 2 for 1958 � 52 for 2008. The contribution of the real price increase to the total financial return on a quality stand continues to be higher than for the average stand of timber in Indiana.
A more detailed edition is at http://www.purdue.edu/fnr/extension/pricereports.shtml