USING FOREST SURVEY DATA IN
MAKING STRATEGIC SUPPLY DECISIONS
Daniel Cassens, Professor of Wood Products at Purdue University
One trend that is occurring throughout the entire forest products industry supply chain, is the importance of long term relationships with fewer suppliers.
Developing long term business relationships with these suppliers strengthens the importance of the supplier-customer commitment between each party, which can have several advantages. The advantages to having a smaller supply base include lower transaction costs, lower inventory due to better planning, and fewer quality related costs all of which translate into improved cash flow, higher profits, and better customer service.
The forest survey inventory data presented in this article can be used by a lumber buyer or producer who is looking to develop long term strategic supply relationships, and capturing these advantages.
By legislative mandate, the U.S. Forest Service is responsible for conducting forest surveys on a state-by-state basis. The Forest Service works in cooperation with each state forestry agency. These surveys have generally been conducted every eight to ten years in the south and at some what longer time periods in the north.
Very recently, legislation has been passed that requires each state to conduct an annual forest inventory. Twenty percent of the total number of plots for each state will be surveyed on a yearly basis, thus substantially reducing the average age of the inventory data. The surveys, which were based on a plot system, are an intense sampling of forest land in a particular state. The original plots are relocated and inventoried for each subsequent survey.
Information collected includes forest acreage and changes; ownership; changes in forest types; volume of growing stock and sawtimber; and growth, mortality and removal of growing stock and sawtimber. Information by individual species, diameter class, county, and many other combinations is also given.
The result is a 100- to 150-page book packed with detailed statistics useful to state and regional foresters, planners, industry, and others. The data presented here are taken directly from these published reports for the lost two survey periods for each state. These reports are generally published as a document titled "Forest Statistics for state, data" The information is also available on the internet from the U.S. Forest Service Home Page (www.fs.fed.us/).
In addition to the state forest surveys, the U.S. Forest Service and state forestry
agencies survey producing mills to determine the amount of wood removed. These numbers do
not always compare directly with the forest survey figures. A number of state foresters
indicated that, at least in these reports, they are unable to account for wood being
exported from the state or even the country. Trees smaller than 11 inches in diameter at
four and one-half feet above the ground may end up producing lumber, but they are included
in the forest survey growing stock volumes and not the sawtimber volumes. These reports
are generally published as a document titled "Assessment of Timber Product Output and
Uses."
In order to remain as consistent as possible from one state to another, only data from the forest surveys are reported here. Anyone desiring more information should consult directly with the appropriate state forestry agency. These agencies are usually able to provide more and better insight than simple statistical numbers. Some agencies will also have reports available on special studies concerning local issues.
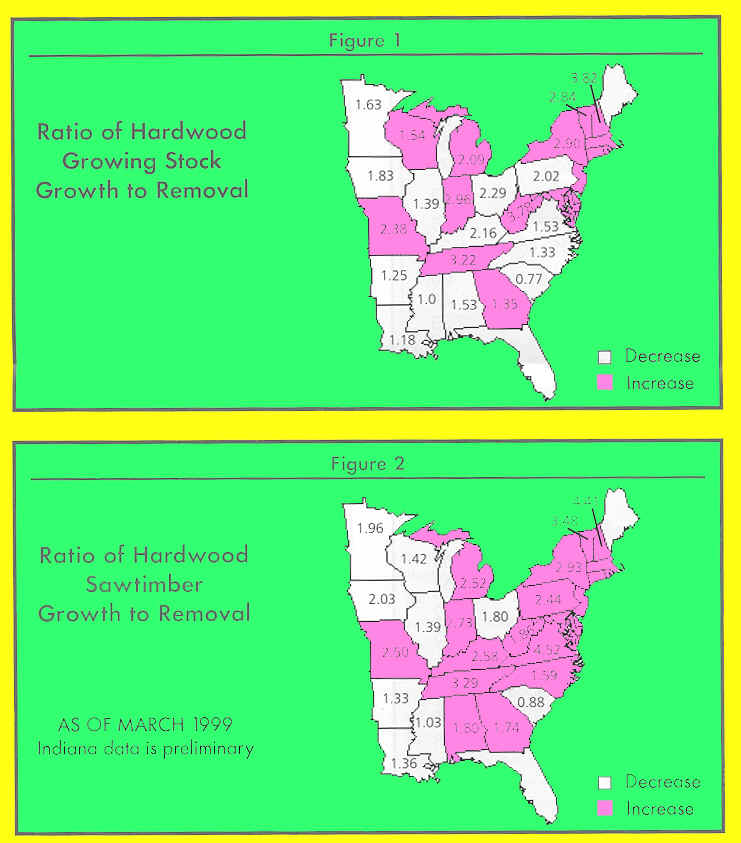
To obtain an overview of general resource availability by state or region, it is useful to look at the ratio of hardwood sawtimber growth divided by removals. Hardwood sawtimber is defined as trees that are at least 11 inches in diameter at four and one half feet above the ground and meeting regional specifications for freedom from defect. A ratio of more than one indicates that more sawtimber is being grown than is being removed.
Before looking at statistics for growth and removals, it is important to understand the significance of each state in terms of the hardwood lumber produced. Table 1 presents the estimated hardwood lumber production by state for 1995. Pennsylvania is the state producing the largest volume of hardwood lumber with just over one billion board feet. It is followed closely by Kentucky and Tennessee. Production by state then decreases gradually.
Table 2 presents the annual new sawtimber growth and removal as well as the ratio of
growth over removals for at least the last two Forest Service survey periods for most of
the hard\wood lumber producing states. It is important to note the dates of the surveys as
some are much more current than others. The time lapse between surveys can also vary. Figure 1 presents the ratio of growth
to removals by state for the most recent Forest Service survey as well as an indicator of
whether this ratio has increased or decreased between the last two survey periods.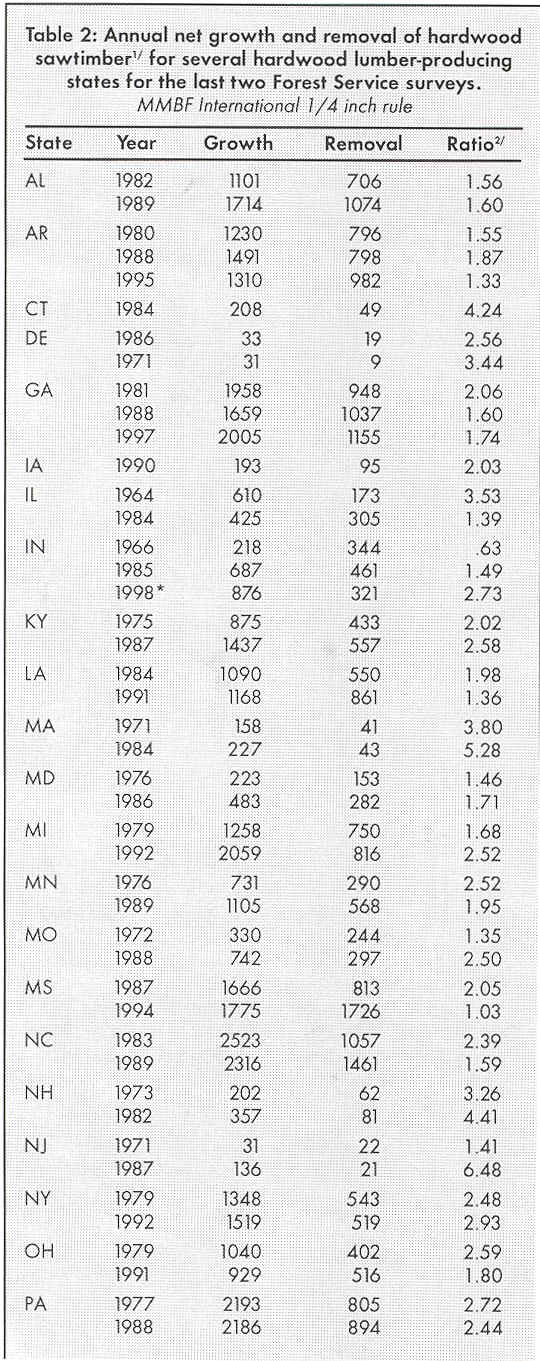
Data from some of the northeastern states (Connecticut, Vermont, New Hampshire, Massachusetts, Delaware and New Jersey) show some of the largest ratios (3.44 to 6.48) of growth to removals. Simply, these states are growing about 3-1/2 to 6-1/2 times more hardwood sawtimber than is being removed. Although large quantities of lumber are not produced in these states, supplies for existing and developing markets appear excellent.
It should also be noted that the ratio of growth to removals has made substantial increases in the most recent surveys as compared to previous ones. From a less positive aspect, timber in heavily populated states with small land areas may not be available for sale or not available in large enough tracts to justify commercial removal. One northeastern state forester's office indicated that if the physical limits to accessibility (Slope, stand size class, stocking) as well as other measures of accessibility (landowner attitude, parcel size, geographical location, capacity of local logging businesses and diversity of local markets) were considered, the growth to removal ratio would be substantially lower.
New York probably deserves special mention. Its estimated lumber production is a substantial one-half billion board feet. It has a very favorable growth to removal ratio of 2.93. The ratio is substantially more than Ohio and Wisconsin, which are comparable in terms of lumber production.
The Midwest and Lake States regions are intermediate in terms of lumber production. The ratios of growth to removal are also intermediate. Like the southeastern pine states, the ratios have decreased in all of these states except Michigan and Indiana. The ratio for Indiana increased substantially from 0.63 in 1966 to 1.49 in 1985. Preliminary data analysis for the Indiana forest inventory completed in 1998 indicate that the ratio is now 2.73. However, the industry in both Indiana and Ohio generally indicate that high value, high grade timber has increased in scarcity.
In Ohio, the ratio for quality oak is very near one and harvesting approximates growth.
Physical inventories in Michigan have resulted in adjustments of past numbers which now
indicate a positive and increasing growth to removal ratio. The surveys for Minnesota and
Wisconsin are ten or more years old and there is some indication that these states may
likewise be showing an increasing and positive growth to removal ratio. It is interesting
to note that several of the top hardwood lumber producing states Pennsylvania, Kentucky,
Tennessee, Virginia, North Carolina and West Virginia are in the Appalachian region. These
states (PA, WV, KY, TN) that dominate hardwood production and with large forested areas
also have some of the largest growth to removal ratios. That is, even with large
quantities of production these states continue to grow an excess of sawtimber.
Furthermore, the growth to removal ratios for WV, KY, and TN have increased 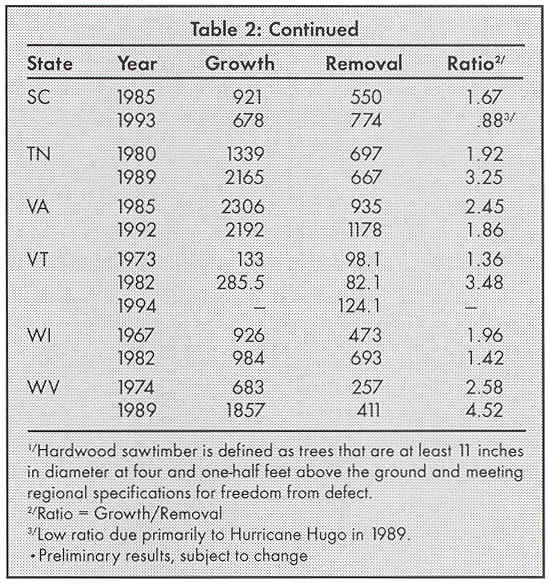 between the last two
survey periods while the growth to removal ratio for PA decreased only slightly.
between the last two
survey periods while the growth to removal ratio for PA decreased only slightly.
Mississippi, Arkansas and Missouri also produce large quantities of hardwood lumber. The ratio of growth to removals has increased in MO but decreased in both AR and MS. In fact, MS has one of the lowest ratios of any state. The survey for MO is from 1988.
It might also be noted that the Atlantic and Gulf coastal states have some of the lower growth to harvest ratios. With the exception of Alabama and Georgia, these ratios have all decreased between the last two survey periods. The increase for AL and GA was rather small. The ratio for South Carolina is particularly low, due in large part to Hurricane Hugo. These states are noted for their southern pine lumber production as well as major pulp and paper production. Hardwood chips have become increasingly important to paper producers and for exporting.
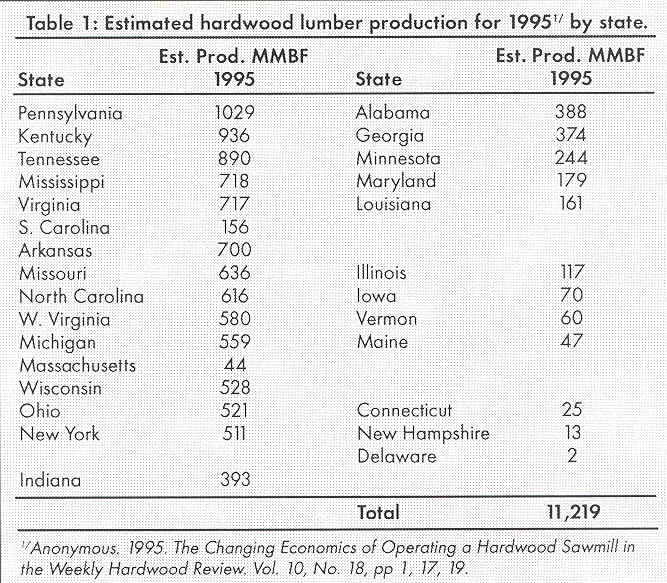
Another statistic of interest is average net annual growth and average annual removals of hardwood growing stock in timberland. Growing stock is defined as the net volume, in cubic feet, of growing stock trees 5.0 inches DBH and larger from a one-foot stump to a minimum 4.0-inch top diameter outside bark of the central stem, or to the point where the central stem breaks into limbs. Growing stock trees are live trees of commercial species classified as sawtimber, pole-timber, saplings, or seedlings; that is, all live trees of commercial species except rough and rotten trees. Thus, growing stock contains the sawtimber volume and should in part reflect it as well as the younger trees which will eventually grow into sawtimber.
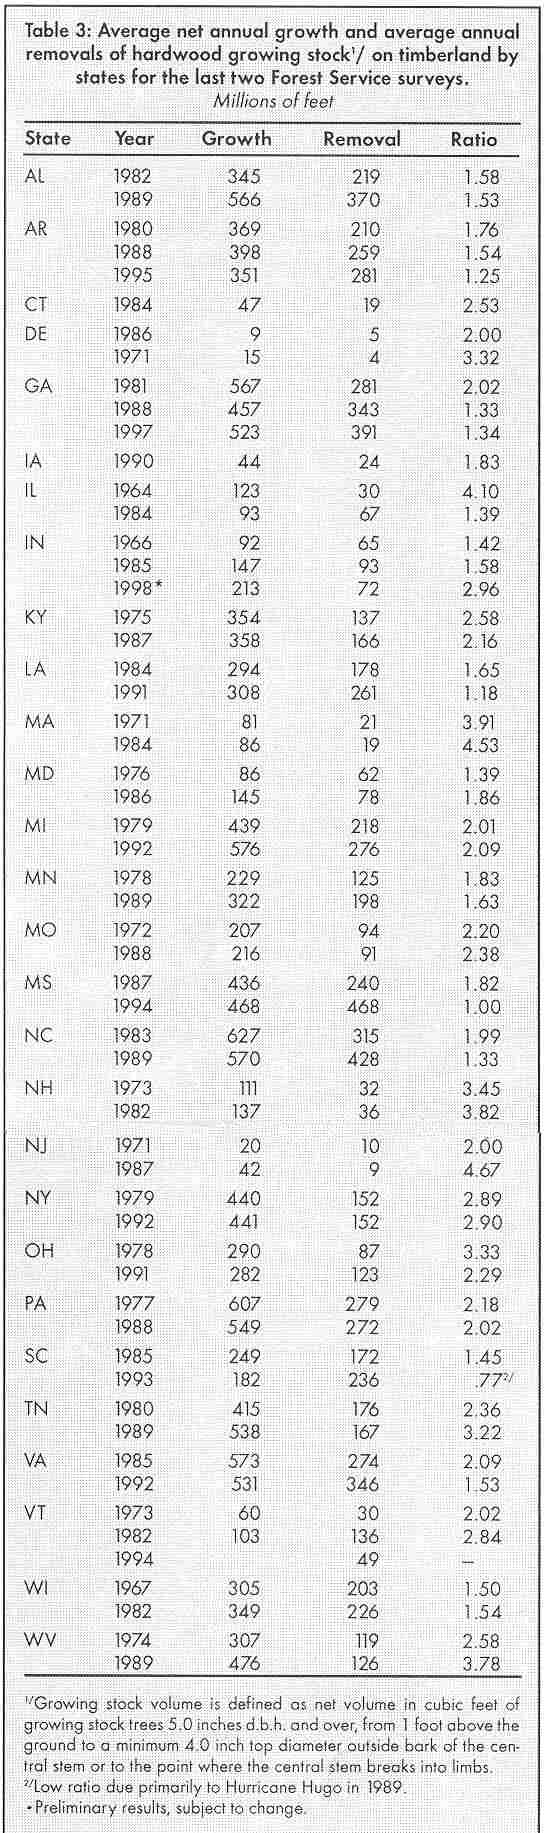 Table 3 presents the average net annual growth and average annual removals of
hardwood growing stock as well as a ratio of the two by state for the last two survey
periods. Figure 2 is a geographical
presentation of the ratios. The northeastern states have all experienced substantial
increases, just as with sawtimber volumes. The ratio has decreased for six of the ten
largest hardwood lumber producing states over the last survey period. The south-eastern
states have all shown a decrease in hardwood growing stock with the exception of GA which
increased very slightly. The Midwest and Lake States of IL, OH, and MN have likewise shown
decreases while MO, IN, Ml and WI have shown slight increases.
Table 3 presents the average net annual growth and average annual removals of
hardwood growing stock as well as a ratio of the two by state for the last two survey
periods. Figure 2 is a geographical
presentation of the ratios. The northeastern states have all experienced substantial
increases, just as with sawtimber volumes. The ratio has decreased for six of the ten
largest hardwood lumber producing states over the last survey period. The south-eastern
states have all shown a decrease in hardwood growing stock with the exception of GA which
increased very slightly. The Midwest and Lake States of IL, OH, and MN have likewise shown
decreases while MO, IN, Ml and WI have shown slight increases.
It is important to note that for the most recent Forest Service surveys, growth in both the sawtimber and growing stock categories exceeds removals in all but one state. In several states the growth is more than double the removals. However, the ratio of growth to removal has decreased between the last two survey periods for several states. Thus, it is probably relatively more difficult for buyers to buy timber in these areas. Issues of quality, timber diameters and general availability are not addressed in the Forest Service surveys.
Buyers of hardwood lumber should look to local markets first. Transportation costs from distant locations are significant and subject to negotiation depending on market demand for lumber. Developing business relationships in those states with favorable growth/harvest ratios, particularly when long term relationships are desirable, would seem to be prudent. Suppliers wishing to expand their business in the logging and sawmill industry should also look to those states with large inventories as well as increasing growth to removal ratios.
These positive growth to removal ratios for sawtimber as well as growing stock indicate that, over all, our hardwood resource is being substainably managed. However, there is some interest from domestic consumers and a larger interest in Europe for documentation that any particular wood shipment is produced from a substainably managed timberland.
The Commonwealth of Pennsylvania has recently announced that all 2.1 million acres of its state forest lands have been certified by Scientific Certification Systems (SCS) of Oakland, CA. These lands represent the largest certified forest in the United States and along with other certified properties are available to fill any existing and developing markets for "certified wood products."
Finally, readers who desire more detailed information are advised to contact their state foresters for a copy of the most recent forest survey report and to speak with an inventory forester. These individuals may have access to additional information and to computerized models which may project current estimates of various forest statistics. The statistics used in this report were taken directly from the published report of each state's inventory.